Performance data analytics
From sensor data to better race decisions
We developed a live analytics platform for a high-performance sailing programme. It brings boat telemetry, weather data and race commentary together and turns them into performance models, race replays and searchable, sourced answers that sailors, coaches and analysts can use during debriefs and race weeks.
Confidential: the client and the teams remain confidential. This page describes the method, and every team shown in the screenshots is anonymised.
The challenge
In a debrief, coaches and sailors want to know where a race was won or lost, and why. The raw material exists but is not usable as it is. Each boat produces hundreds of sensor channels, sampled several times a second, across speed, loads, attitude, wind and boat geometry. The tactical knowledge in race commentary is unstructured and hard to search, and neither source connects to the other.
What we did
- Brought the data together: pipelines that clean and label raw telemetry, local wind forecasts, and a searchable knowledge base built from race commentary.
- Turned it into performance insight: models for manoeuvre cost, ideal routing and start-line positioning, built on calibrated boat performance.
- Put it in the team’s hands: an interactive dashboard with 2D and 3D race replay, and an AI layer that answers questions with its sources.
Approach
1. Bring the data together
Raw telemetry moves through three layers (bronze, silver and gold). The first makes the sensor files queryable; the second cleans the signals, detects every tack, gybe and mark rounding and splits each race into segments; the third summarises races and legs. The dashboard and the AI layer read the summaries first, so most questions are answered without reprocessing raw files. Race commentary is structured and indexed alongside, so it can be searched by meaning.
Race, leg and event summary tables, pre-computed
Smoothed signals; every tack, gybe and rounding detected and segmented
Raw files in a queryable format, no business logic
Hundreds of channels, several samples a second
2. Turn it into performance insight
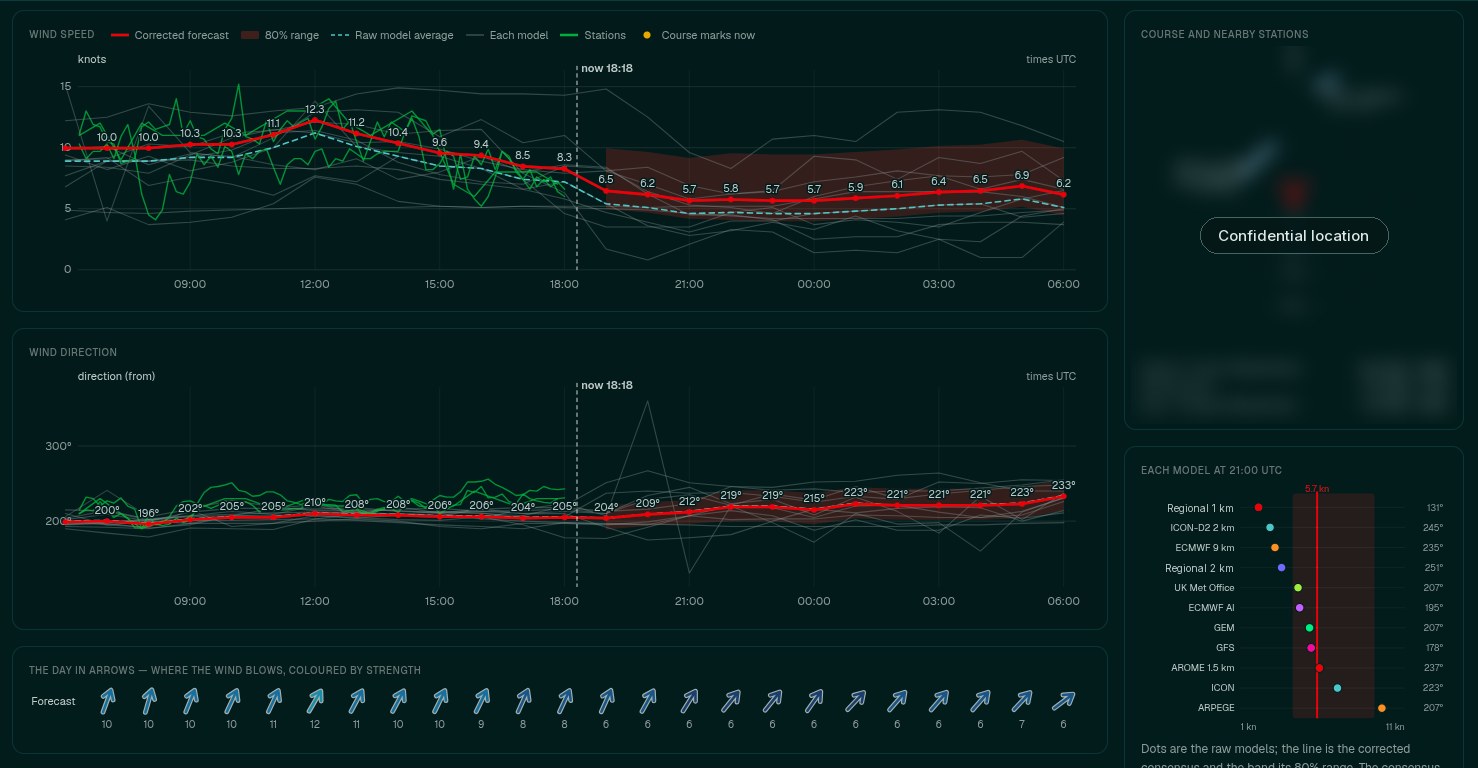
Boat speed alone can mislead, so we measure what each manoeuvre costs in progress towards the mark. Combined with calibrated boat performance and a reconstructed wind field, those costs feed a routing model that estimates the fastest way a leg could have been sailed. Separate analysis covers start-line positioning, and local wind forecasts are corrected against nearby weather stations and shown with their uncertainty.
3. Put the insight in the team’s hands
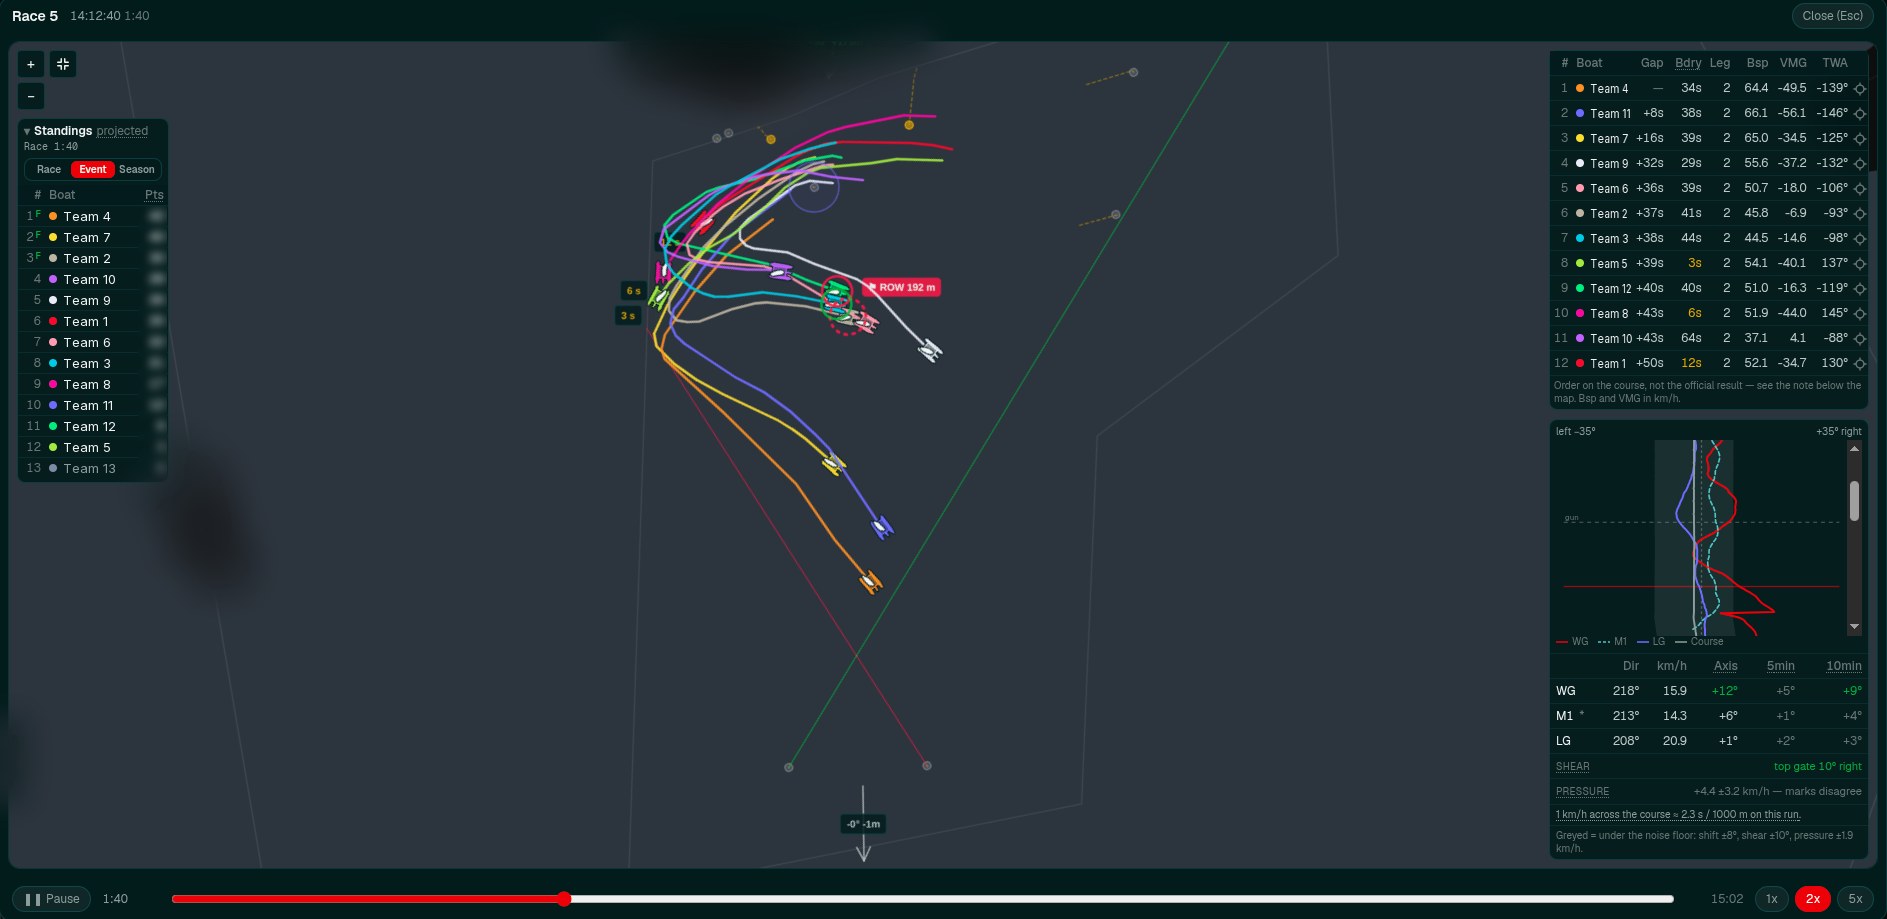
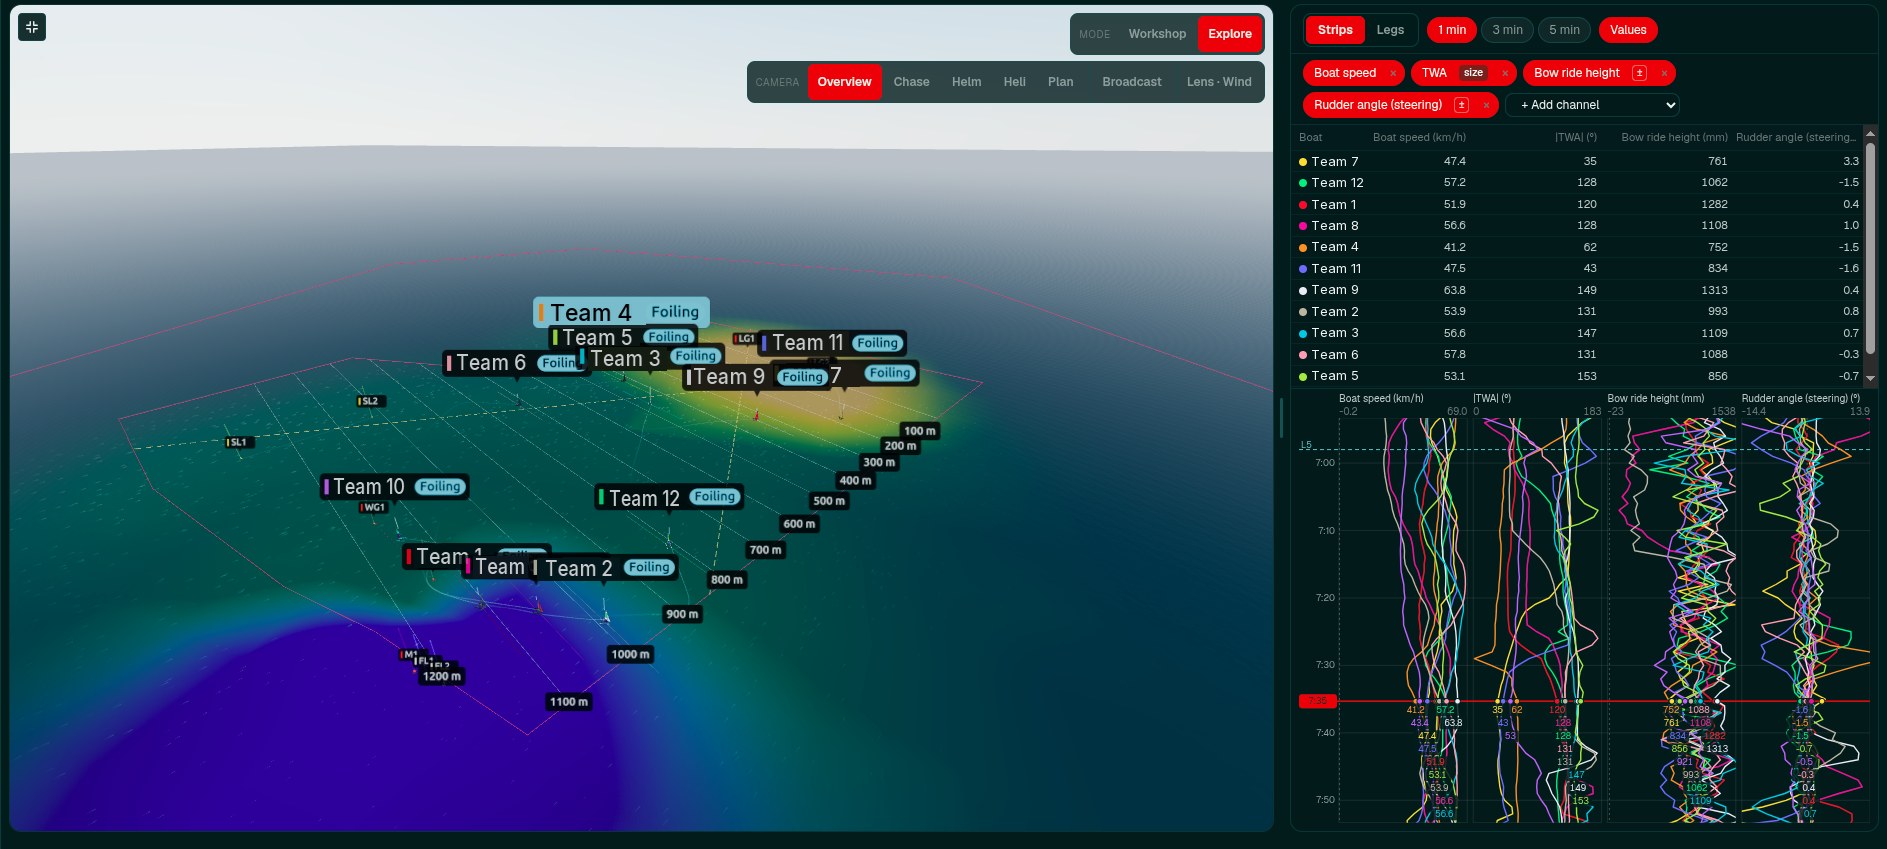
The dashboard brings the analysis together: race replay in 2D and 3D, the modelled ideal line beside the tracks actually sailed, and performance views for each boat. The AI layer builds on the same data. A master agent passes each question to specialist agents for telemetry, race commentary and web research, and the answer comes back summarised and linked to its sources, so users can check where it came from rather than take it on trust.
Outcome
The platform is live. Sailors, coaches and analysts have used it in debriefs and race weeks to explore performance and get sourced answers, without waiting for manual analysis. It has grown through direct feedback from the people using it.
Facing a similar challenge?
A first conversation takes about 30 minutes and costs nothing.